
Standalone Executive Summary Report (`summary.html`)
When configured with singleSummaryFile: true, Zen Reporter generates a standalone, lightweight executive summary report named summary.html in your output directory alongside index.html.
📑 Purpose & Target Audience
Section titled “📑 Purpose & Target Audience”While index.html is designed for interactive deep-dive debugging with complete step execution traces, inline source code snippets, and trace file attachments, summary.html is tailored specifically for:
- Engineering Management & Leadership: Quick release readiness assessments.
- QA & Product Stakeholders: High-level test pass/fail ratio metrics.
- Automated Notifications: Light HTML report attachments for Slack notifications, email summaries, or release audit documentation.
⚙️ Enabling summary.html
Section titled “⚙️ Enabling summary.html”Enable executive summary generation in playwright.config.ts:
import { defineConfig } from '@playwright/test';
export default defineConfig({  reporter: [    [      '@arpanp/zen-reporter',      {        outputDir: 'zen-report',        singleSummaryFile: true, // Generates summary.html alongside index.html      },    ],  ],});
🔍 Visual Components & Features
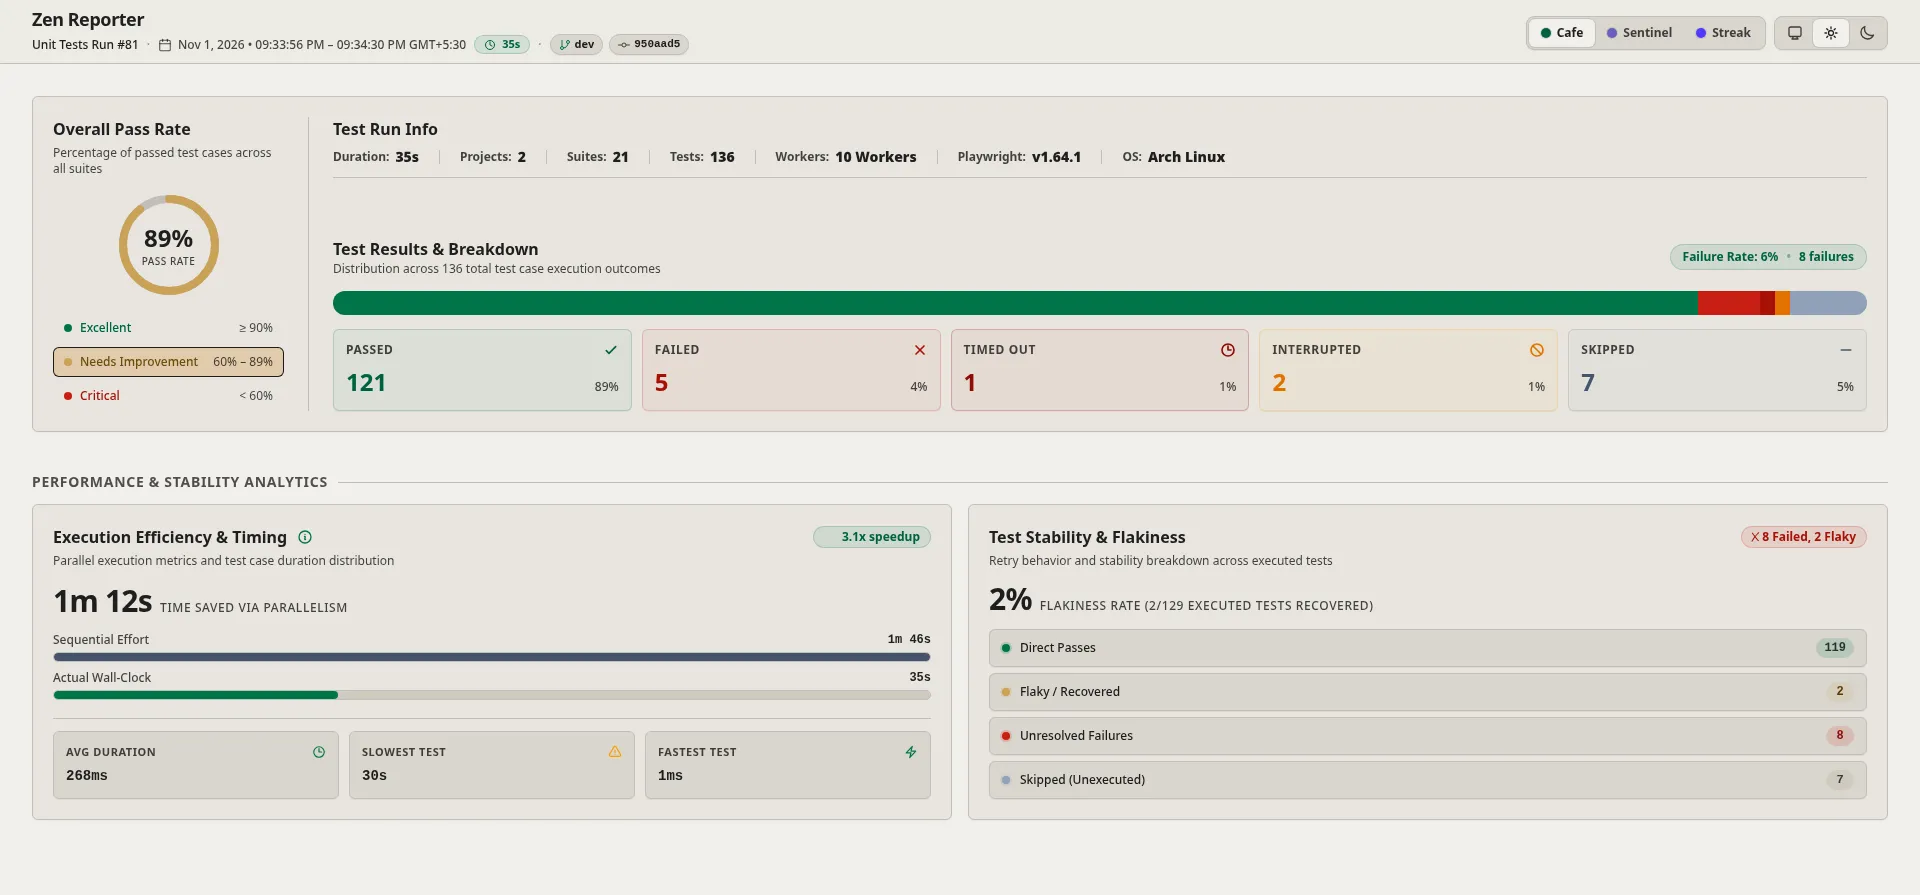
Section titled “🔍 Visual Components & Features”summary.html provides the complete high-level dashboard layout in a standalone, single-page presentation without navigation sidebars, failure stack traces, or large media attachments:
Key Dashboard Sections in summary.html
Section titled “Key Dashboard Sections in summary.html”- Persistent Header Bar: Displays the project name, test run identifier (e.g.,
Unit Tests Run #146), start and end timestamps, wall-clock duration pill (⏱ 31s), segmented theme picker (Cafe,Sentinel,Streak), and 3-way appearance toggle (System, Light, Dark). - Overall Pass Rate Gauge: Prominent radial donut chart indicating the suite’s pass rate (e.g.,
77% PASS RATE) along with health threshold tiers (🟢 Excellent $\ge 90%$, 🟡 Needs Improvement $60% - 89%$, 🔴 Critical $< 60%$). - Test Run Info: Inline summary metrics detailing test run Duration, Project count, Suite count, Test count, parallel Worker thread allocation, Playwright version, and host OS.
- Test Results & Breakdown: Proportional outcome stacked progress bar (with overall failure rate badge) and dedicated outcome status cards for
PASSED,FAILED,TIMED OUT,INTERRUPTED, andSKIPPEDcases. - Performance & Stability Analytics:
- Execution Efficiency & Timing: Highlights speedup multiplier (e.g.,
2.5x speedup), time saved via parallel worker execution (45s TIME SAVED VIA PARALLELISM), comparative progress bars (Sequential Effort vs. Actual Wall-Clock), and test timing benchmarks (Avg Duration, Slowest Test, Fastest Test). - Test Stability & Flakiness: Tracks flakiness recovery rate (e.g.,
3% FLAKINESS RATE (2/66 EXECUTED TESTS RECOVERED)), anomaly counter badge, and category breakdown (Direct Passes, Flaky / Recovered, Unresolved Failures, Skipped).
- Execution Efficiency & Timing: Highlights speedup multiplier (e.g.,
Key Differences (summary.html vs index.html)
Section titled “Key Differences (summary.html vs index.html)”| Feature | index.html (Full Interactive Report) |
summary.html (Executive Summary) |
|---|---|---|
| Sidebar Navigation | Full collapsible sidebar (Overview, Projects, Suites, Files, Failures, History, Insights, Trends) | No sidebar — single clean executive view |
| Deep-Dive Failure Traces | Full step-by-step traces (▶), syntax-highlighted code frames, text diffs, clipboard copy |
High-level status breakdown & failure counts only |
| Media Attachments | Inline screenshots, interactive video player, and Playwright .zip traces |
Excluded to ensure ultra-fast loading & small file size |
| Historical & AI Analytics | Full DuckDB regression tracking, file/test histories, and trend charts | Focused on the current execution run summary |
| File Size & Portability | Larger (comprehensive test artifacts and deep diagnostic logs) | Extremely lightweight single-file HTML ideal for email, Slack, or CI release artifacts |