
Suite & Spec File Explorer
Viewing test results of a large test suites with hundreds of describe blocks and spec files can be overwhelming. Zen Reporter provides two dedicated explorer views: Suites (interactive tree view) and Files (paginated spec file metrics table).
🌳 Interactive Suite Tree (Suites Tab)
Section titled “🌳 Interactive Suite Tree (Suites Tab)”The Suites tab presents your test suites and spec files in an interactive, collapsible hierarchy tree view.
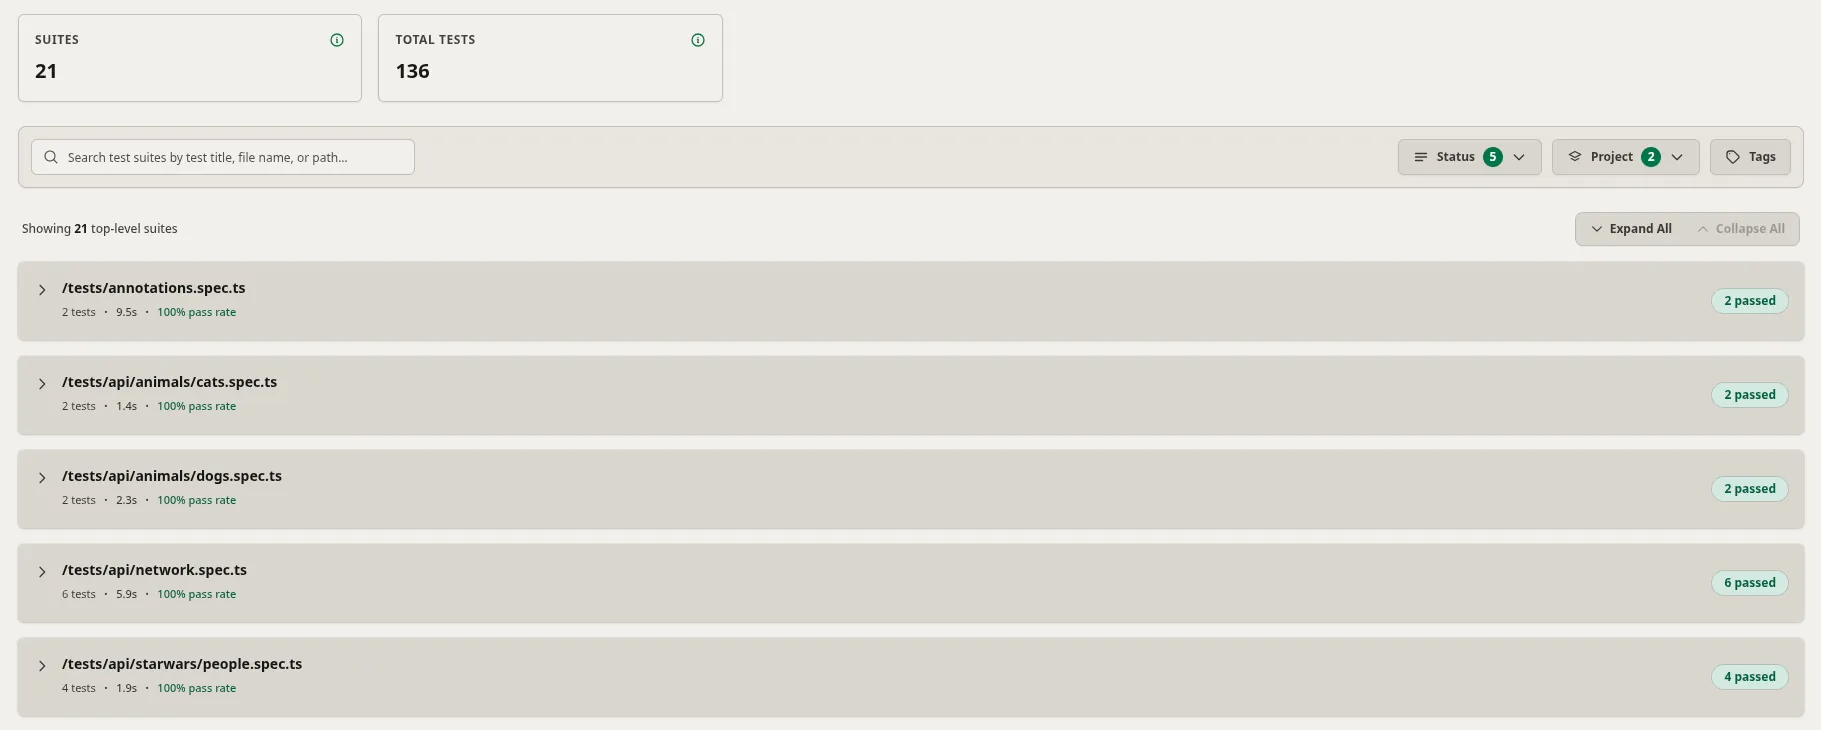
Key Features of Suite View
Section titled “Key Features of Suite View”- Top Suite KPI Cards: Summary cards at the top showing high-level test run metrics:
- Suites: Total count of evaluated suites (e.g.,
12). - Total Tests: Total count of test cases evaluated across suites (e.g.,
70).
- Suites: Total count of evaluated suites (e.g.,
- Search & Multi-Dimensional Filtering Toolbar:
- Live Search: Instant search input filtering suites by test title, file name, or spec path.
- Status Filter: Dropdown with badge count (e.g.,
Status (5)) to filter by execution outcome (Passed, Failed, Timed Out, Interrupted, Skipped). - Project Filter: Dropdown with badge count (e.g.,
Project (2)) to filter across Playwright project configurations. - Tags Filter: Tag selector button to filter by custom
@tagannotations.
- Bulk Expand / Collapse Controls: Quick-action buttons (
Expand All/Collapse All) alongside the suite count indicator (e.g.,Showing 12 top-level suites). - Collapsible Suite & File Cards:
- Shows file path (e.g.,
/tests/failures.spec.ts), test count, execution duration (e.g.,57ms), and pass rate percentage (e.g.,0% pass rate). - Color-coded outcome pills on each card summarizing results:
passed,failed,timed out,interrupted, andskipped.
- Shows file path (e.g.,
- Nested Describe & Test Hierarchy: Infinite nesting support for
test.describe()groups and individual test case steps with collapsible tree toggles. - Inline Test Case Details & Attachments: Click on any test node to view step execution logs, retry attempt history, failure code frames, video recordings, screenshots, and Playwright
.ziptraces.
📄 Spec Files View (Files Tab)
Section titled “📄 Spec Files View (Files Tab)”The Files tab aggregates test execution metrics at the spec file level, giving QA managers and engineers a file-by-file breakdown of suite health, execution density, and duration ranking.
1. Top Summary KPI Cards
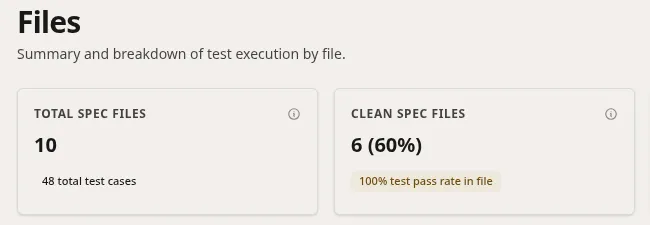
Section titled “1. Top Summary KPI Cards”A top horizontal bar summarizing overall spec file statistics:
- Total Spec Files: Count of all evaluated spec files (e.g.,
10files containing48 total test cases). - Clean Spec Files: Proportion of spec files with a 100% pass rate (e.g.,
6 (60%)with a100% test pass rate in filebadge). - Failing Spec Files: Count of spec files containing test errors (e.g.,
4with a40% of files have errorsbadge). - Files with Retries: Count of spec files requiring test retries to complete (e.g.,
1with a10% of files required retriesbadge). - Failure Concentration: Percentage ratio of failure concentration pointing to the top failing spec file (e.g.,
40%concentrated in/tests/failures.spec.ts).
2. File Density & Duration Benchmarks
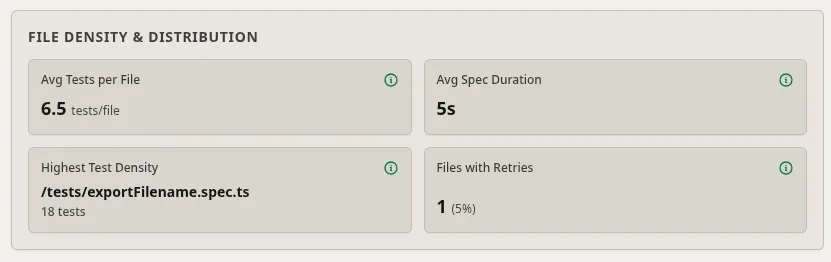
Section titled “2. File Density & Duration Benchmarks”Two side-by-side analytical cards providing execution distribution metrics:
- File Density & Distribution Card:
- Avg Tests per File: Average number of test cases contained per spec file (e.g.,
4.8 tests/file). - Avg Spec Duration: Average wall-clock execution duration per spec file (e.g.,
7s). - Highest Test Density: Identifies the spec file containing the most test cases (e.g.,
/tests/config.spec.tswith10 tests). - Files with Retries: Count and percentage of files executing retries (e.g.,
1 (10%)).
- Avg Tests per File: Average number of test cases contained per spec file (e.g.,
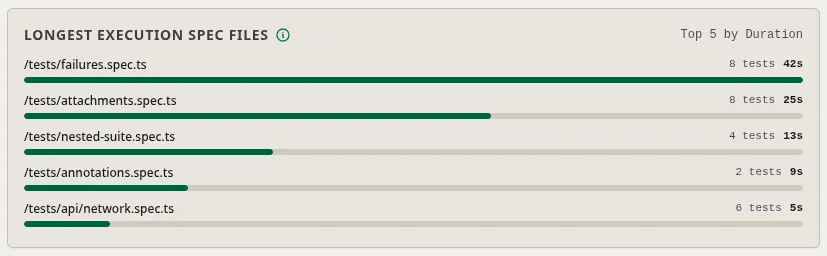
- Longest Execution Spec Files Card:
- Ranks the Top 5 Spec Files by Duration with visual progress bars indicating test count and wall-clock execution time (e.g.,
/tests/failures.spec.ts-8 tests, 1m 0s).
- Ranks the Top 5 Spec Files by Duration with visual progress bars indicating test count and wall-clock execution time (e.g.,
3. Test Results by File Table
Section titled “3. Test Results by File Table”A comprehensive paginated breakdown table (Test Results by File) providing file-by-file outcome analytics:
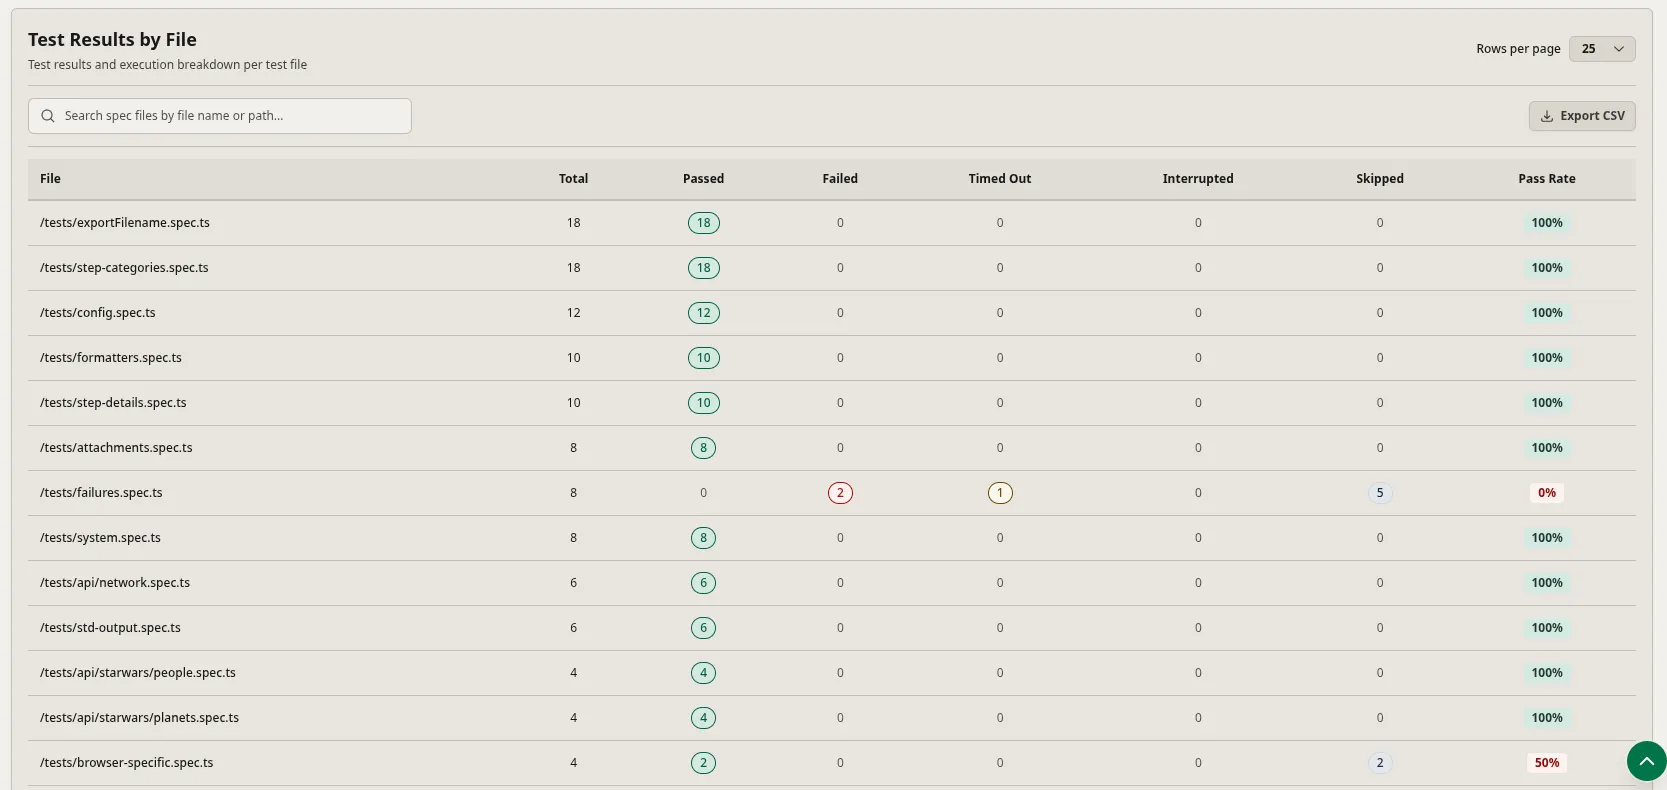
- Search & Pagination Controls: Filter spec files on the fly via the search box (
Search spec files by file name or path...), adjust page size (Rows per page: 25), and paginate through pages (Previous/Next). - Export to CSV: One-click Export CSV button in the table header to download the full file-level results dataset.
- Detailed Metrics Columns:
- File: Path of the test spec file.
- Total: Total number of test cases in the file.
- Passed: Count of passed tests, highlighted with green pills.
- Failed: Count of failed tests, highlighted with red pills when errors occur.
- Timed Out: Count of timed-out tests, highlighted with yellow/amber pills.
- Interrupted: Count of aborted/interrupted tests, highlighted with red pills.
- Skipped: Count of skipped tests, highlighted with soft blue pills.
- Pass Rate: Proportional pass percentage badge for the spec file (e.g.,
100%,0%).
💡 Best Practices
Section titled “💡 Best Practices”- Tag & Project Filtering: Use the multi-dimensional filter bar on the Suites tab (
Status,Project,Tags) to narrow down large test suites to specific browser environments or test categories (like@smoke). - Isolating Failure Hotspots: Review the Failure Concentration card and examine the Test Results by File table to identify spec files with low Pass Rates that contribute most to build instability.
- Analyzing Duration Bottlenecks: Inspect the Longest Execution Spec Files card to identify top long-running spec files and optimize parallel worker allocation or split test cases.
- Inspecting Media & Trace Attachments: Open test case cards directly from the Suites tree to preview failure screenshots, watch video recordings, and download Playwright
.ziptrace files for deep offline debugging. - Exporting Metrics for BI & Reporting: Click Export CSV on the Test Results by File table to export file metrics for QA management reports and compliance audits.